Building an Org Chart Component in UI Builder
I have always resisted UI Builder, but resist I can no more. In this post I’ll explain what I’ve learned while building out an org chart component on a workspace in UI Builder. I’m going to be using the Node Map component as my starter.
Figuring out how Node Maps work
I started out today by figuring out how the Node Map component worked. This took hours. I eventually ended up with a Node Map component with zero preset. This allowed me to understand Node items and Edge items. Node items are the objects and Edge items are the connections between the objects (nodes).
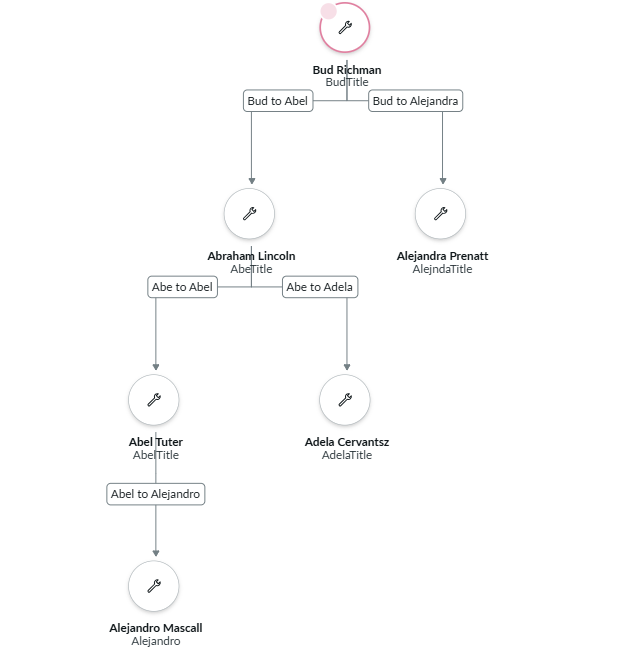
To start out, I drew out my hierarchy on a piece of paper. This looked like a standard family tree. Each person, in sequential order, was marked with a number. This number is representative of the node number, which will come into play below. To save yourself some trouble in the future, maybe try picking names that don’t all start with A.
In the below screenshot, my nodes are my people, and my edge items are, for all intents and purposes, the lines between. (Ignore the pink circle around Bud.)
The code powering this
Each node has a unique ID, which in my case will be values like n1 or n2 (recall the numbers I assigned to people above). This is relevant for both the node and edge code, because that number will represent each node in the node code, and we’ll also use it as a value against sourceID and targetID in the edge code – basically to draw the line between nodes.
Node code
[
  {
    "id": "n1",
    "viewData": {
      "primaryLabel": "Bud Richman",
      "secondaryLabel": "BudTitle",
      "status": "pink"
    }
  },
  {
    "id": "n2",
    "viewData": {
      "primaryLabel": "Abraham Lincoln",
      "secondaryLabel": "AbeTitle"
    }
  },
  {
    "id": "n3",
    "viewData": {
      "primaryLabel": "Alejandra Prenatt",
      "secondaryLabel": "AlejndaTitle"
    }
  },
  {
    "id": "n4",
    "viewData": {
      "primaryLabel": "Abel Tuter",
      "secondaryLabel": "AbelTitle"
    }
  },
  {
    "id": "n5",
    "viewData": {
      "primaryLabel": "Adela Cervantsz",
      "secondaryLabel": "AdelaTitle"
    }
  },
  {
    "id": "n6",
    "viewData": {
      "primaryLabel": "Alejandro Mascall",
      "secondaryLabel": "Alejandro"
    }
  }
]
Edge code
Here, each edge has its own unique ID, e1 and so on. There is also a sourceId, which corresponds to the parent node number, and a targetId, which also corresponds to the child node number. I’ve also added label to help myself visualize the connection.
[
  {
    "id": "e1",
    "sourceId": "n1",
    "targetId": "n2",
    "label": "Bud to Abel"
  },
  {
    "id": "e2",
    "sourceId": "n1",
    "targetId": "n3",
    "label": "Bud to Alejandra"
  },
  {
    "id": "e3",
    "sourceId": "n2",
    "targetId": "n4",
    "label": "Abe to Abel"
  },
  {
    "id": "e4",
    "sourceId": "n2",
    "targetId": "n5",
    "label": "Abe to Adela"
  },
  {
    "id": "e5",
    "sourceId": "n4",
    "targetId": "n6",
    "label": "Abel to Alejandro"
  }
]
Figuring out styling
That chart isn’t super pretty to start with. It isn’t super intuitive to change how everything looks – and especially less so to modify the Node view macroponent into something like a contact card. With that said, with a few configurations, we can make the diagram look much cleaner:
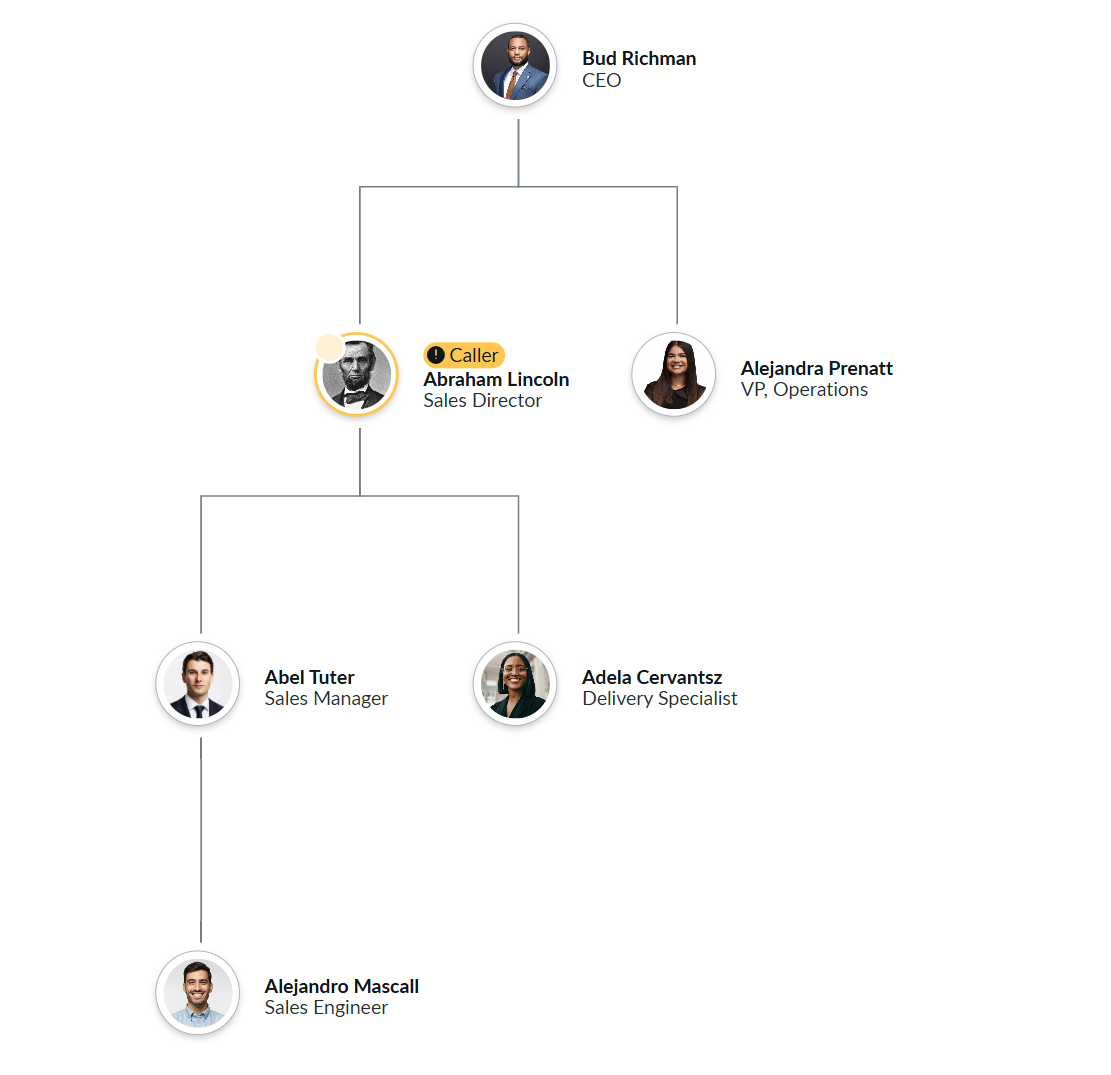
To make these tweaks, I did the following:
- Updated the position titles in the node code JSON so they made more sense
- Added an
imageproperty to the JSON tags of the node code, and linked images I uploaded into the Images[db_image]table - Changed the Status and Status message JSON properties in the node code for Abe
- Changed the Edges type to Joints arrow
- Checked the box to Hide edge arrows
- Changed the Label position in the Nodes style options to End
- Similarly in the Nodes style options, I updated the Width and Height to the Auto options (respectively)
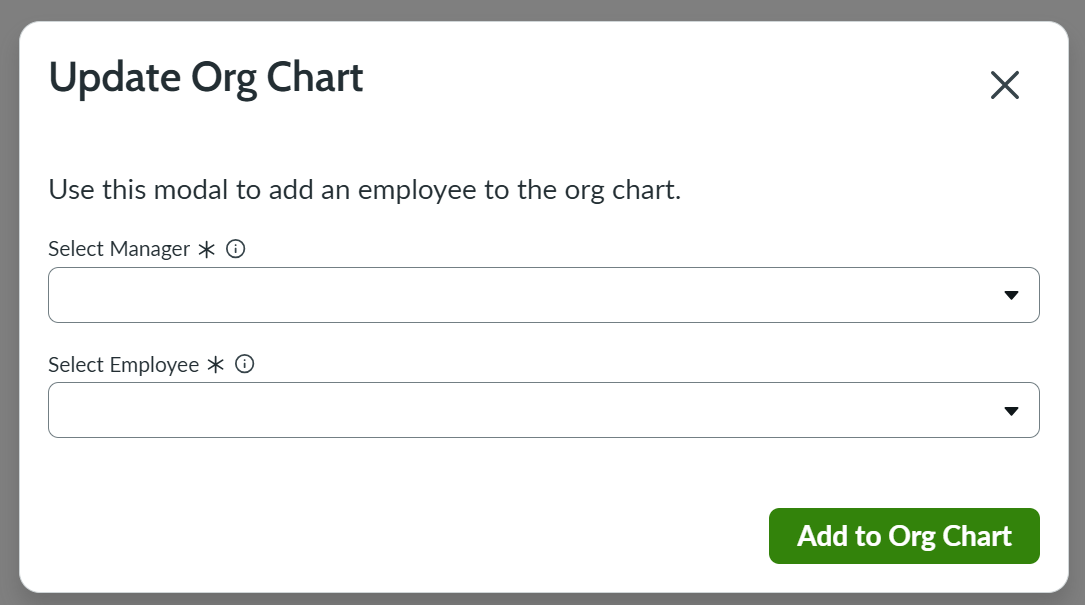
At this point, it looks pretty good. I’ve also added an additional button, that displays at the top of the page, titled Update Org Chart. When this button is pressed, a modal will appear, where the user can select a manager and employee and update the node map. Because the data is currently dynamic, this updates a client state parameter to add the user to both the node and edge map scripts (the code for which has already been moved into a client state parameter). It also calls an event to show an alert.
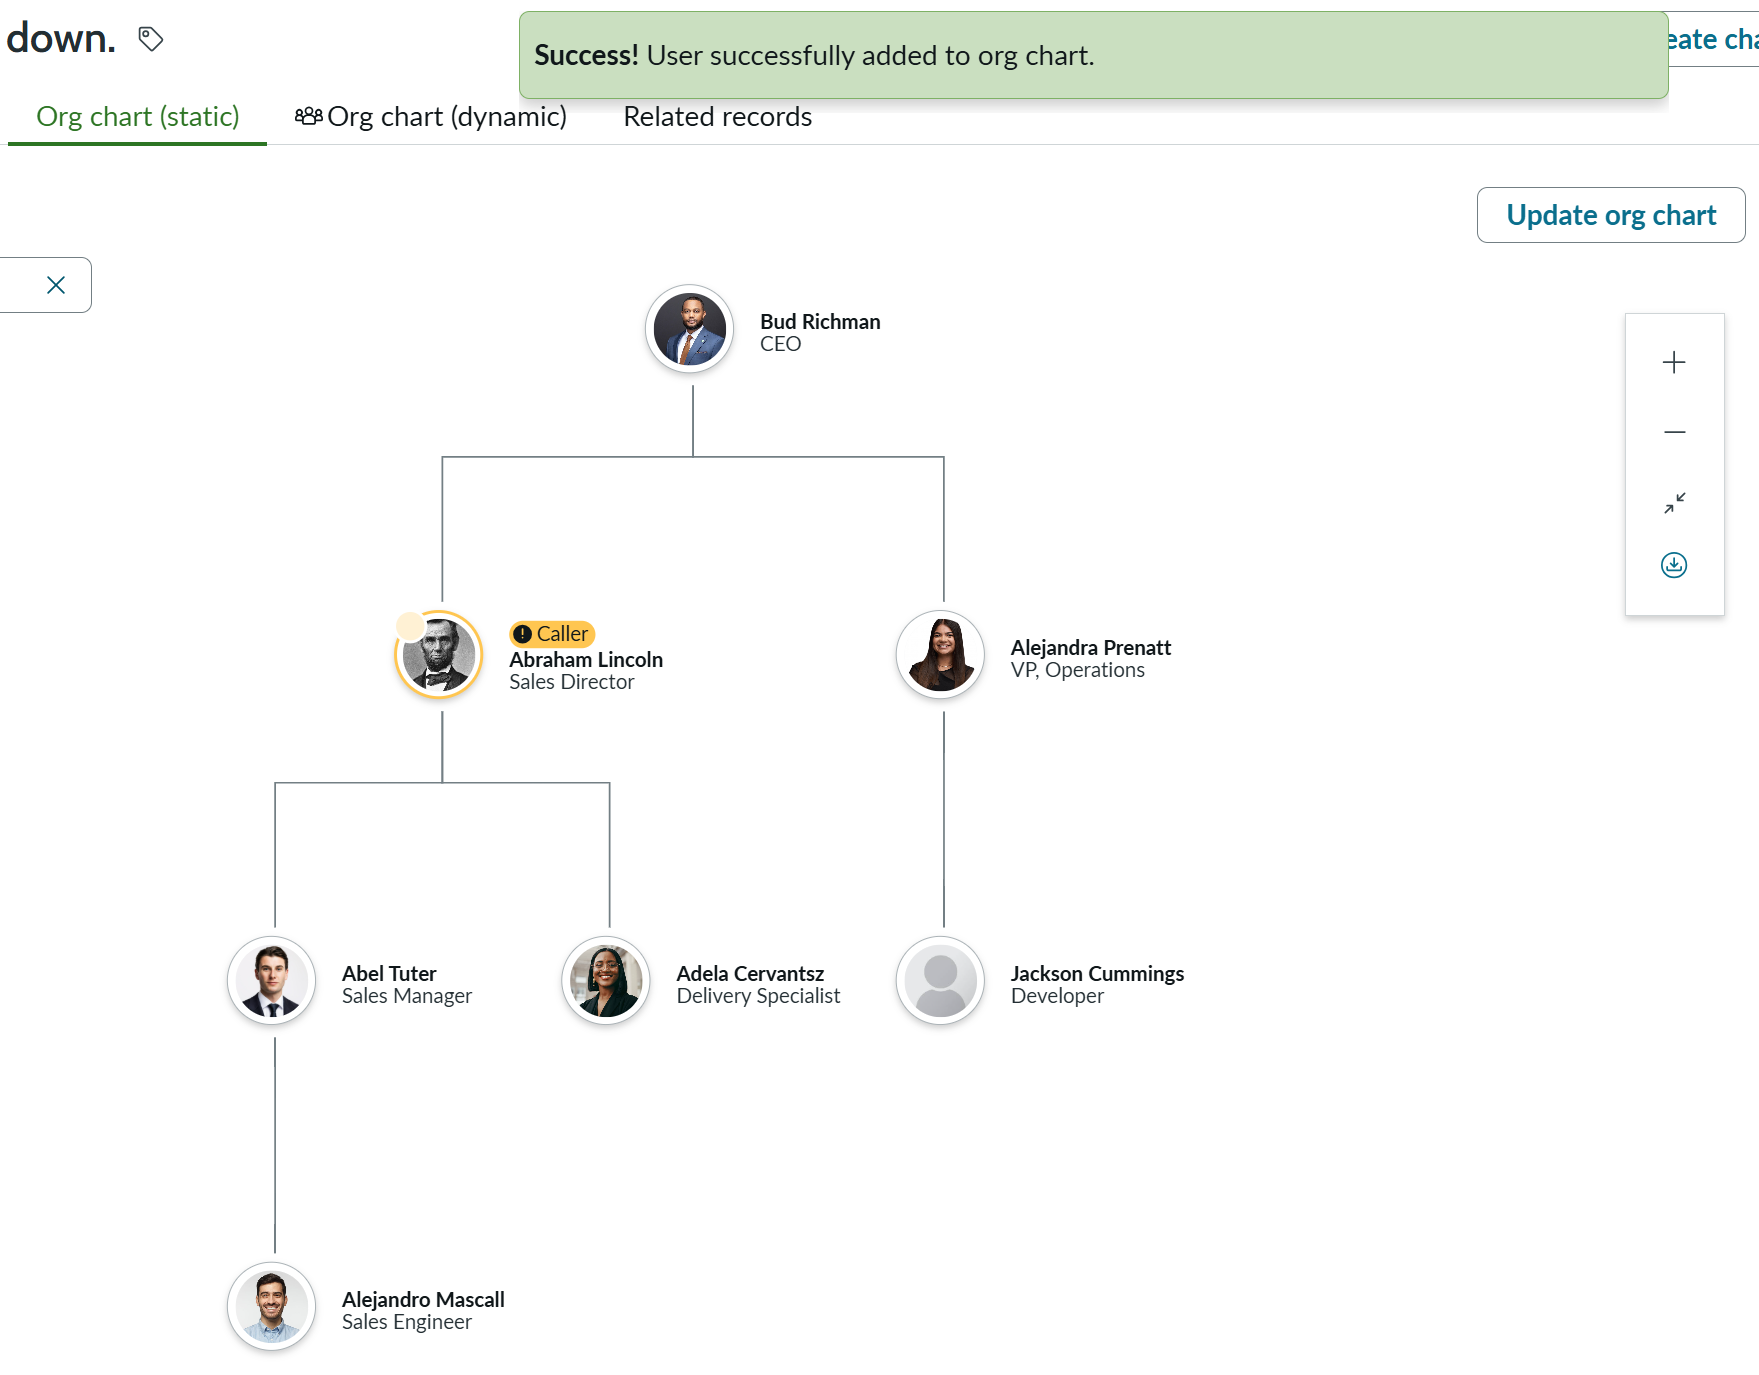
Check it out:
This screenshot shows the success message, the user (myself) added, as well as the original button I clicked to open that modal.
Iterating
I’ve made a few changes since the words right above this (which doesn’t mean anything to you, dear reader, but trust me, it’s been a while). To start, I made an adjustment to my modal. I added the ability to either create a new user or use an existing one.
Now, when you click the button to Update Org Chart, you’ll see other options in the modal. The value selected will conditionally hide or display the subsequent input fields.
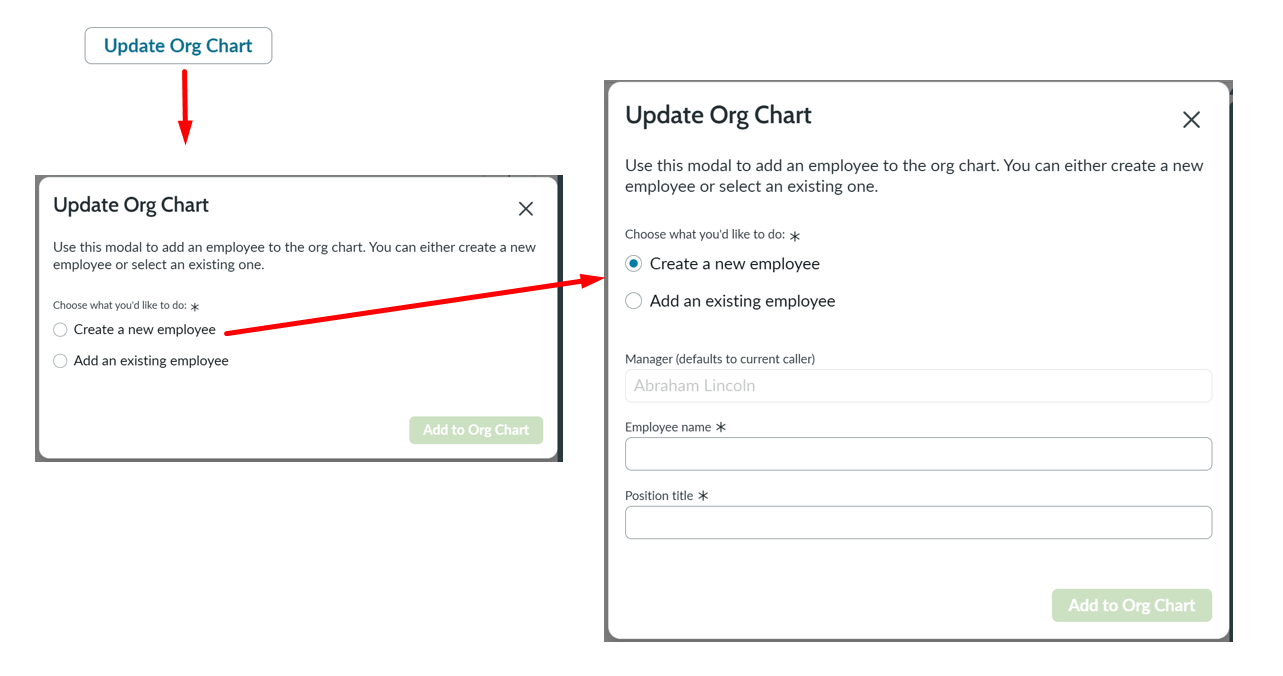
I also added field validation (sorta – see the section on Field validation below for more details). So now, you’ll need to input values in the boxes before you can click the Add to Org Chart button.
When you add a new user, it truly does write to the User [sys_user] table. We see a success message displayed and a link to the newly-created user’s record, as indicated in the screenshot below. It also adds the user to the org chart (but see the section Making the button and its response more dynamic below for more details).

To accomplish the new user thing, here’s what I did:
- I created a “Create Record” Data Resource and named it “Create User Record”
- I added events to the data resource, relying on the trigger Operation Succeeded:
- The first event logs the new sys_id to the console (which can be removed, but is kept for now),
- The second event sets a client parameter with the sys_id (retrieved from
event.payload.data.output.data.GlideRecord_Mutation.insert_sys_user.sys_id.value, which I found in the console), and - The third event calls a client script to display the alert
- I added a (conditional: new employee) event to my “Add to Org Chart button” that executes this “Create User Record” data resource
Here’s what my alert client script looks like:
function handler({api, event, helpers, imports}) {

    var userSysId = api.state.newUserSysId;
    //console.log('User sys_id is ' + userSysId);
    var url = "https://***INSTANCE***.service-now.com/nav_to.do?uri=sys_user.do?sys_id=" + userSysId;
    //console.log('After url: ' + url);

    api.emit("NOW_UXF_PAGE#ADD_NOTIFICATIONS", {
        items: [
          {
            id: "alertSuccess",
            status: "positive",
            content: "Success! The user has been created and added to the org chart. ",
            action: {
              type: "dismiss"
            },
            textLinkProps: {
              label: "View the user's record here.",
              href: url
            }
          }
        ]
    });
}
Future enhancements
This is not perfect. It’s very much static, meaning that it doesn’t respond to changes in the Caller on the record, and a lot of what’s happening must follow a very specific demo script. Below are a few things I’d work on if I had more time.
Open questions
- If I were to make the create user record dynamic, do I need to set up empty client state parameters to capture the inputs? I can’t seem to bind to my component.
- It looks like there’s a new operator called “is in hierarchy” … would that be used?
- Is there a more efficient way to assess multiple selections being made? Specifically with things like select boxes – can we quickly check if both boxes are occupied, without having to update a client state parameter via an event for each?
- Can you combine events (like setting two client state parameters at once)?
- How difficult is it to update the node style macroponent?
Making this more dynamic
I obviously would like to have this functioning 100% dynamically – meaning the entire org chart would respond to the caller. But in addition to just setting the nodes and edges, I’d have to re-work a lot of what’s already been built – since I built my modals in a static way. That’s detailed down below.
Ways to make this more dynamic
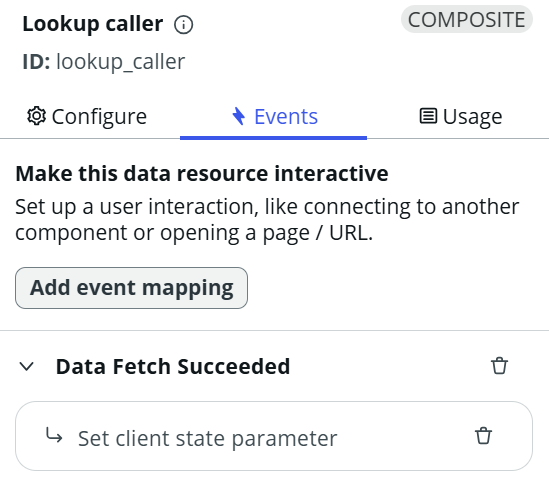
I was able to get a step closer to achieving this by setting a client state parameter with the value of the caller’s sys_id, after the successful retrieval of the looked up user by the server. This is crucial, because when the server script runs, it misses the user in the caller box (for whatever reason). With this addition, we’re able to store that user’s sys_id and retrieve it later. I was able to get this functioning via the Events tab of the data lookup (see screenshot below).
Some of the remaining steps include:
- Using my client state parameter, looking up the reports of the caller
- Somehow setting the node/edge scripts based on that value (I believe this would have to be a script, which I have a starter for thanks to this Community post
- Updating the styling of the nodes
Field validation
In my pop-up, you’ll notice that the Add to Org Chart button is disabled. I was able to achieve this by setting the component’s disabled state based on a data bind – in this case, I bound it to the client state parameter btnAddToOrgChartDisabled. By default, this parameter is set to true.
When the user fills out the input fields, an event reverses the flag on that parameter.
Where I could improve this: Currently, the event is only tied to the second (bottom-most) input/select field. So when we’re creating a new employee, that’s the position title, and when we’re adding an existing user, that’s the employee select box. I did this on the second field because logically, you’d fill out the fields in order. But as it stands, you technically only need to fill out the second field, for either use case.
Making the button and its response more dynamic
My node scripts and edge scripts are static. They are stored on page load in a client state parameter, and after the “Add to Org Chart” button is clicked, the client state parameter gets updated to include the new value. The new values are hard coded.
For instance, no matter who you select in the “add existing employee” box, Jackson will always be nested under Alejandra. To fix this, I’d need to grab the value selected in both the manager and employee boxes, and somehow transform this into script to insert into the node/edge scripts.
Similarly, the “add new employee” boxes do not actually respond to what’s inputted. It will always add John Smith with the position Sales Agent. This would be slightly easier to do, as my Create User Record execution (and event in my button) can pull from those inputs. However, this doesn’t solve the problem of transforming this information and inserting it into node/edge scripts.
So for demo purposes, I must showcase the existing employee portion first, because it adds Jackson to the org chart. The new employee, John, can be added afterwards – but the node/edge scripts rely on Jackson already being there. If we did the new employee portion first, we’d see both Jackson and John appear together, which wouldn’t make sense. While my events are conditional based on the new/existing employee selection, the order of the demo is important.
Where I could improve this: It all comes back to the dynamic data unfortunately. I don’t know how else to get around this one.
Reducing my events (if possible)
I don’t know if it’s possible to combine multiple Set client state parameter events, but I’d like to do so if I could. I have a distinct node and edge scenario for each selection option (new/existing employee). I also have two conditional alert notifications. Additionally, I reset client parameters after the button is clicked (re-disabling the button, and clearing the new/existing selection). I think this has to be kept though.
Where I could improve this: Reducing what I can…
Changing the styling
My requirement hoped for the org chart to be displayed with each user in a box with additional fields. To change this, I’d need to modify the Node view macroponent with my custom styling. But that’s a little too complex for me at this time.
Where I could improve this: Updating the macroponent/creating a new one to display the extra information and in the requested style.